

Steps to Generate Course Reports within Project Results
This is the source to create the individual course results.
- Click on the link in the Results email or log in to Blackboard.
- The link will take you directly to the CES Dashboard.
- In Blackboard, click on Tools on the Main Page not on your Course Page.
- Click on Watermark - CES Course Evaluations Box. The screen shown below will appear.
- The boxes shown on the dashboard are called widgets and there is one for each part of the CES Process.
- Under the Project Results widget, click on the semester project link that you want
to view.
- The project names will include the semester and year followed by Main Course Evaluation.
- If the project you are looking for is not shown, click the Results tab and then on
Project Results.

- Please read the special Note message. This pertains to those courses that may not appear under Project Results.
- If for some reason a semester’s evaluation project does not appear in the widget box, then please see instructions on No Project Results.
- The course(s) that received enough data for results will be listed.
- A result report can be viewed and generated for each course. Select the course you want to view onscreen or export to PDF or Excel. Click on the icon under Report.
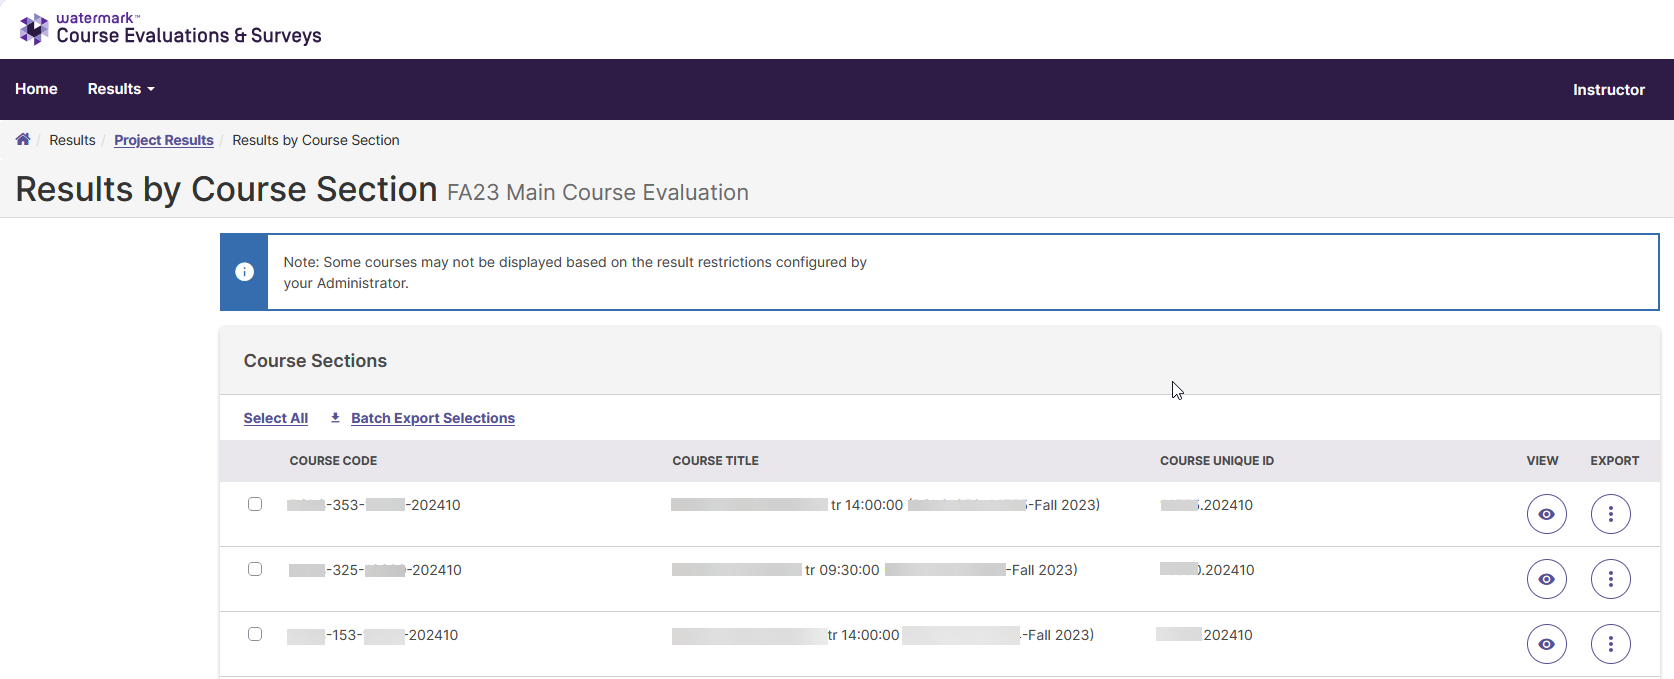 View Selection: If you click on the view icon, it will display the results on screen.
- The default view will be "Detailed Report."
- Select the down arrow in the view box for the other options.
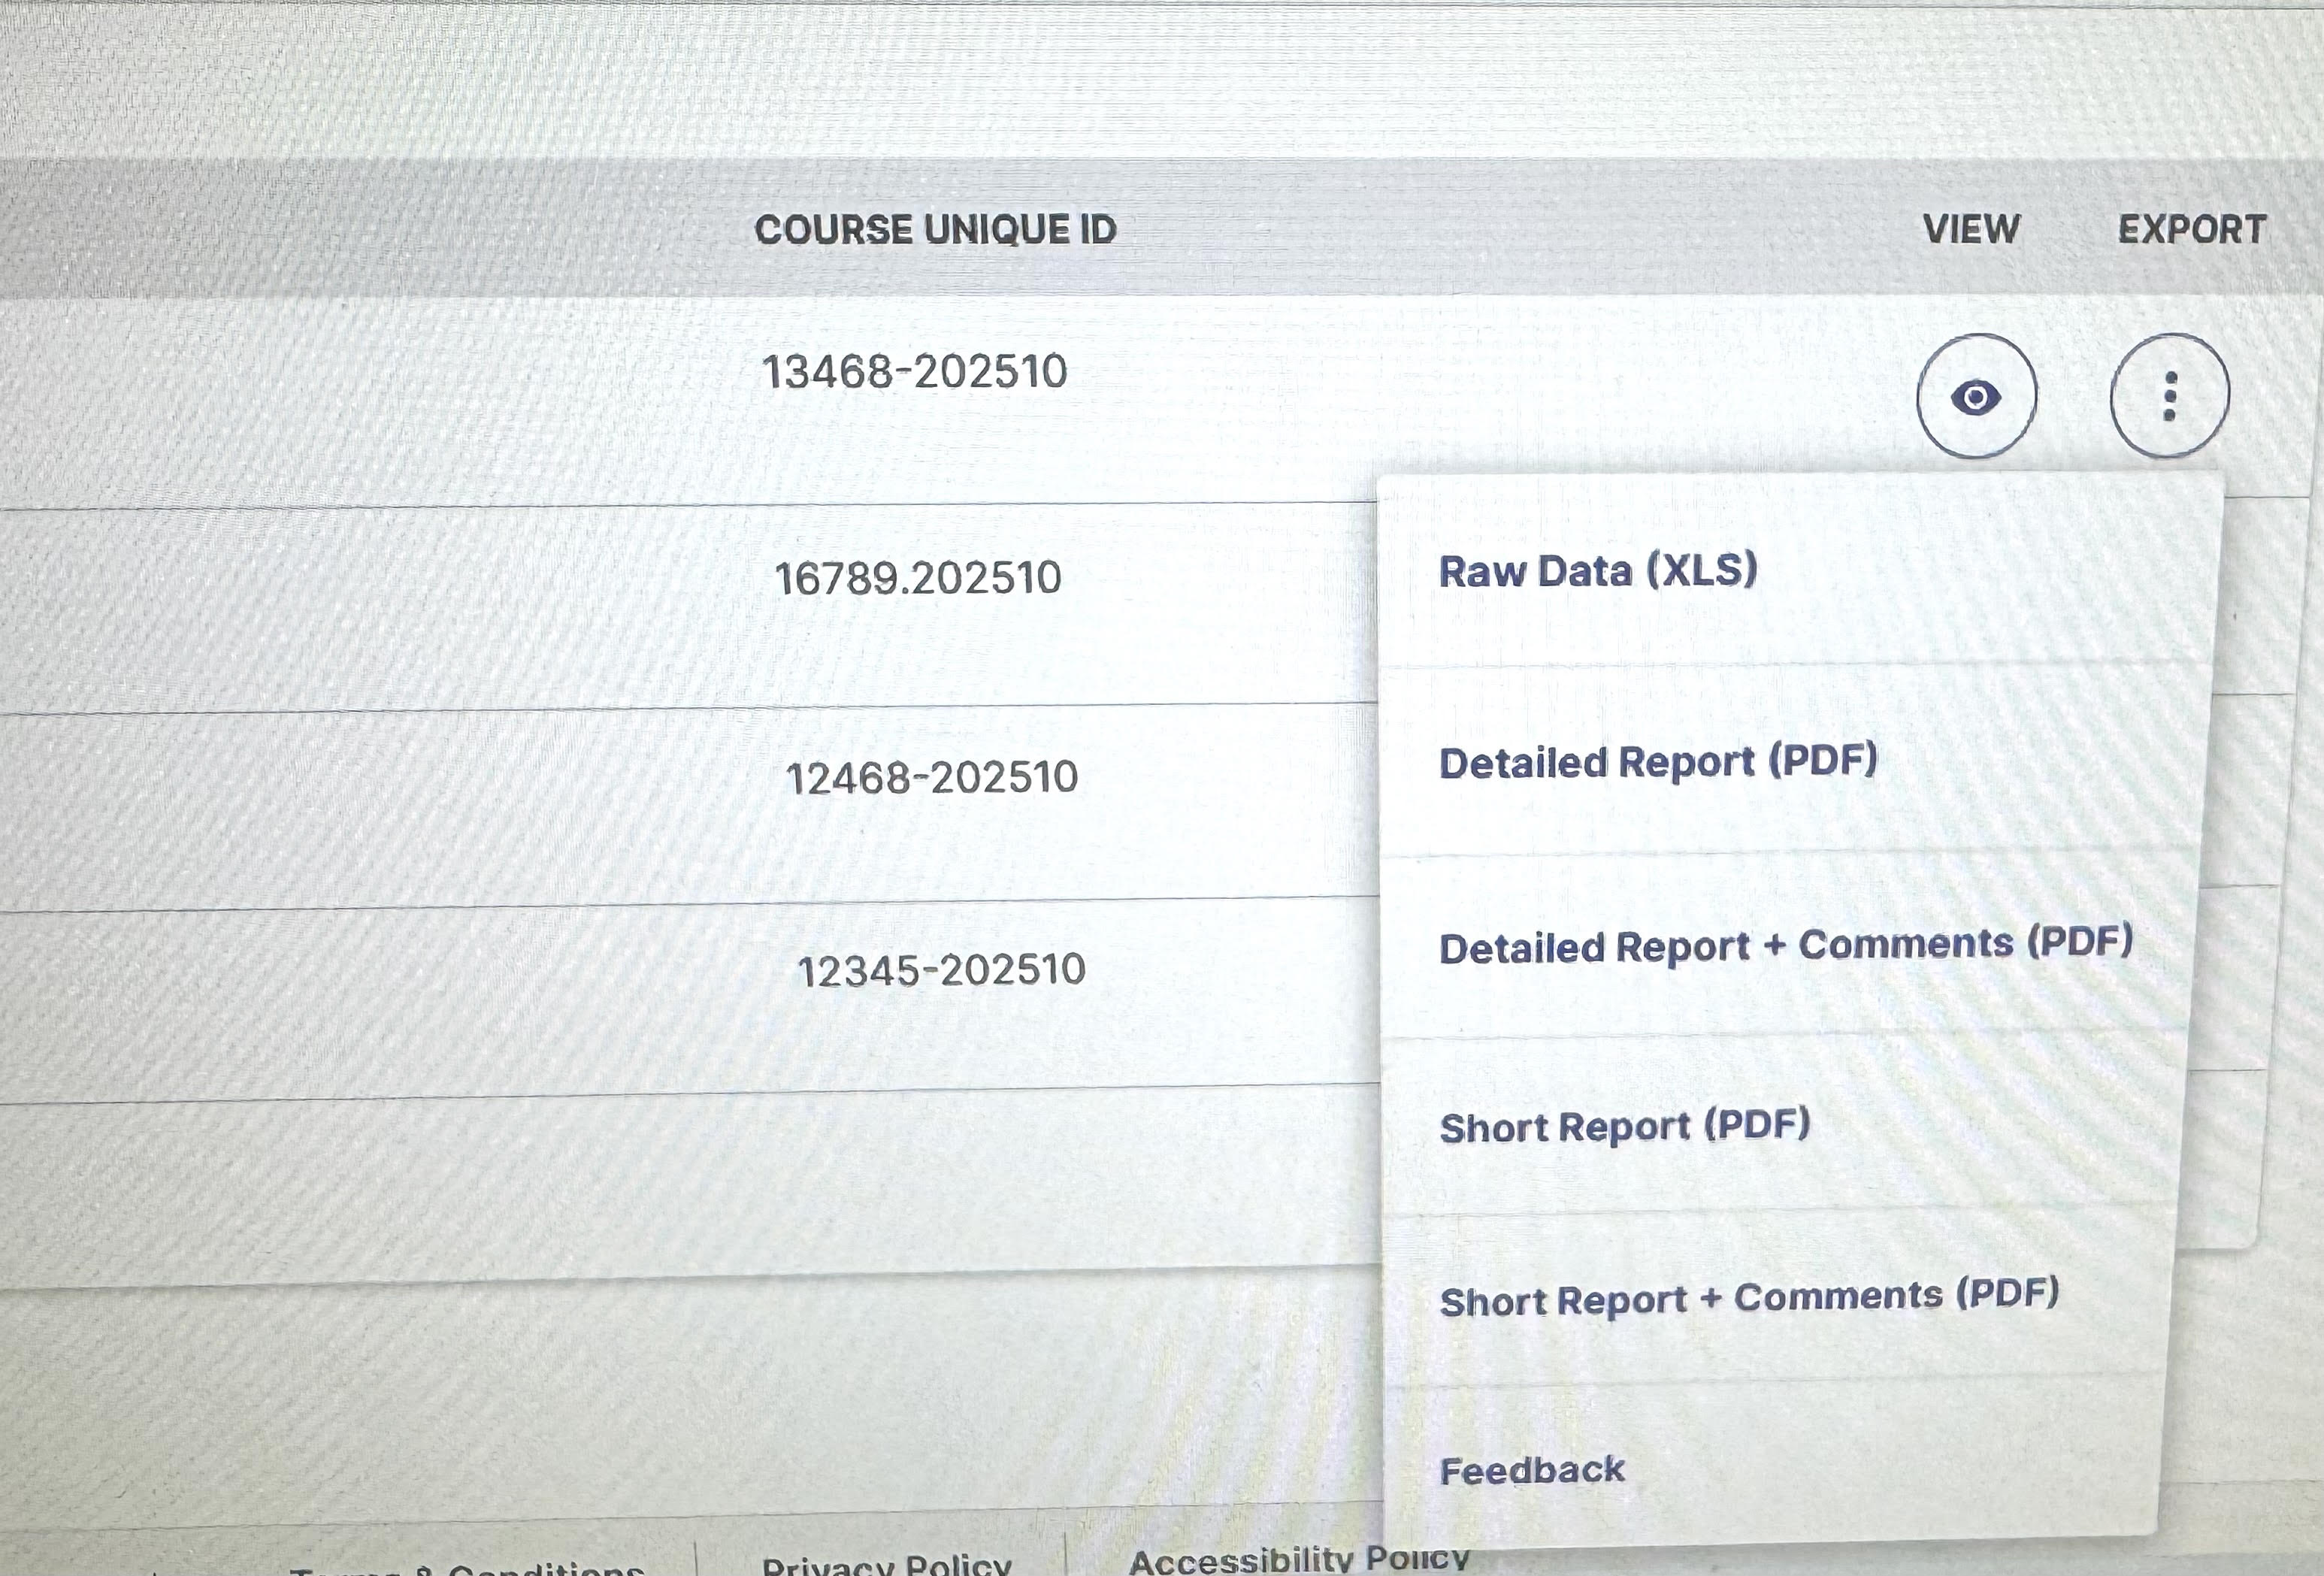 Export Selection: If you click on the export icon, it will list the various report
options.
- Select one of the report options listed. The Detailed Report + Comments will provide you with the statistics compiled as well as the student's comments.
- CES will create a PDF or Excel report. The course data will be saved with Watermark and can be retrieved at any time. You do not have to print or save a copy unless you want to.
- The generated report will go to the Downloads folder.
- The layout of the course evaluation report:
- It will show the semester's project title.
- It will list the course, instructor, and the overall response rate.
- Depending on the report selection, it will list the results. Below is an example of a Detailed Report.
- The bottom of the report will list the Mean of Means Calculations.
- If you would like to have more information regarding each report, see Types of Results Reporting.
- Watermark’s Course Evaluations & Surveys platform will store all course evaluation results. You will be able to view them at any time.

